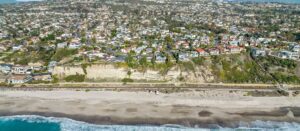
The Orange County housing market heading into November 2026 is one where I would put preparation ahead of urgency. Across South Orange County, I’m watching the balance between higher borrowing costs, slower demand, and sellers who still need to make a clear case for their asking price.
The national picture: slower demand, but not a distressed market
Nationally, the 30-year fixed mortgage rate is about 7.3%, near a 3-year high. The 10-year Treasury reached 5.28% in September and is now about 5%. Those are important pieces of the affordability picture, especially when buyers are deciding what monthly payment feels manageable.
Stock market gains that helped buyers this spring are fading. Demand is cooling, with the largest slowdown in the tight-inventory markets of the Northeast and Midwest. Inventory is edging higher, but prices are holding in most markets, with a +1.5% year-over-year change.
I would not confuse that slowdown with a distressed market. Delinquencies and foreclosures are expected to remain very low into 2027. For me, the takeaway is straightforward: buyers have reasons to be selective, while sellers need to stay grounded in current conditions. More available homes and slower demand do not, by themselves, tell us that prices are falling everywhere.
National market at a glance
October 2026
What it means for Orange County
Orange County has 4,948 active listings, compared with 4,288 last year and a pre-2020 average of 6,010. There is more selection than last year, but available inventory remains below that earlier benchmark.
Demand is 1,219, the lowest October since 2007, versus 1,546 last year and a pre-2020 average of about 2,200. Expected market time is 122 days, the highest since January 2019, compared with 83 days last year and a pre-2020 average of 85 days. In plain English, it estimates how long the available inventory would take to sell at the current pace of demand—not how long any particular home will sit.
The mortgage rate is 7.33%, and rates have been above 7% since September 11. Meanwhile, September saw 1,042 delistings, 37% above last year. I see that as a reminder that not every listing ends in a sale.
In the luxury segment above $2.5M, there are 958 listings, demand of 150, and an expected market time of 192 days. Distress remains limited: 18 homes, or 0.4% of listings.
September closed resales totaled 1,729, down 4% year over year, with a 99.1% sale-to-list ratio. My read is a slower market that calls for realistic expectations, not a blanket assumption that every seller is under pressure.
Orange County: this October vs. last year and pre-2020
Late October 2026, all home types
See the numbers
| Active listings | Demand | Expected market time | |
|---|---|---|---|
| October 2026 | 4,948 | 1,219 | 122 days |
| October 2025 | 4,288 | 1,546 | 83 days |
| 2017–2019 average | 6,010 | 2,200 | 85 days |
Getting the price right from the start
September’s closed sales make a useful case for getting the asking price right from the start. Among those sales, 68% had no price cut, sold at 100% of the last list price, and had a median market time of 11 days.
Another 14% reduced their price by 1-4%, sold at 98.4% of the last list price, and took 56 days. The remaining 18% cut prices by 5%+, sold at 97.8% of the last list price, and took 81 days.
Meanwhile, 45% of active listings have had a price cut. That does not prove a reduction caused a longer sale, but it does show why I would rather discuss pricing carefully before going live than rely on adjustments later.
My advice is to use comparable sales and today’s competition to set a defensible asking price. The goal is not simply to avoid a reduction; it is to give buyers a clear reason to take your home seriously.
Priced right the first time sells faster
Orange County closed sales, September 2026
See the numbers
| Share of sales | Days to go pending | Sale vs. last list price | |
|---|---|---|---|
| No price cut | 68.0% | 11 days | 100.0% |
| Cut 1% to 4% | 14.0% | 56 days | 98.4% |
| Cut 5% or more | 18.0% | 81 days | 97.8% |
City by city
For September 2026 closed sales, all home types, each local median below exceeded Orange County’s $1.209M median; explore all Orange County market reports for the broader comparison.
San Clemente
San Clemente recorded a median sale price of $2.2M, 55 homes sold, a median of 13 days on market, and a 98.8% sale-to-list ratio. That shorter selling timeline would keep me focused on being prepared when the right San Clemente home comes along. See the full San Clemente market report
Dana Point
Dana Point recorded a median sale price of $2.43M, 31 homes sold, a median of 32 days on market, and a 98.4% sale-to-list ratio. For a Dana Point coastal search, I would keep the individual home’s value ahead of assumptions based on its asking price. See the full Dana Point market report
Laguna Beach
Laguna Beach recorded a median sale price of $3.09M, 26 homes sold, a median of 59 days on market, and a 96.1% sale-to-list ratio. Laguna Beach’s longer selling timeline is a reason to examine pricing carefully rather than rush a decision. See the full Laguna Beach market report
Laguna Niguel
Laguna Niguel recorded a median sale price of $1.39M, 62 homes sold, a median of 22 days on market, and a 98.2% sale-to-list ratio. Its lower median relative to nearby Dana Point and Laguna Beach makes Laguna Niguel worth comparing when those communities are on your list. See the full Laguna Niguel market report
Irvine
Irvine recorded a median sale price of $1.44M, 176 homes sold, a median of 38 days on market, and a 97.3% sale-to-list ratio. Irvine has the largest sales count among these local snapshots, though I would still narrow the comparison to homes that fit your search. See the full Irvine market report
Newport Beach
Newport Beach recorded a median sale price of $3.74M, 76 homes sold, a median of 42 days on market, and a 96.9% sale-to-list ratio. For a Newport Beach coastal property, I would let closely comparable sales guide the pricing conversation rather than the citywide median alone. See the full Newport Beach market report
Corona del Mar
Corona del Mar recorded a median sale price of $4.31M, 22 homes sold, a median of 31 days on market, and a 98.1% sale-to-list ratio. In Corona del Mar, I would keep the conversation property-specific; a high median is not a price tag for every home. See the full Corona del Mar market report
Newport Coast
Newport Coast recorded a median sale price of $6.48M, 7 homes sold, a median of 16 days on market, and a 95.2% sale-to-list ratio. This is a small sample, so I would be cautious about using this Newport Coast snapshot to price an individual property. See the full Newport Coast market report
San Juan Capistrano
San Juan Capistrano recorded a median sale price of $1.83M, 32 homes sold, a median of 14 days on market, and a 99.0% sale-to-list ratio. San Juan Capistrano’s shorter selling timeline makes preparation worthwhile when a home matches your priorities. See the full San Juan Capistrano market report
Talega
Talega recorded a median sale price of $2.2M, 13 homes sold, a median of 34 days on market, and a 98.2% sale-to-list ratio. This is a small sample, so I would treat it as context for a Talega search rather than a firm pricing rule. See the full Talega market report
How our cities compare
Closed sales, September 2026, all home types
See the numbers
| Median sale price | Homes sold | Days on market | Sale-to-list | |
|---|---|---|---|---|
| San Clemente | $2,200,000 | 55 | 13 days | 98.8% |
| Dana Point | $2,430,000 | 31 | 32 days | 98.4% |
| Laguna Beach | $3,087,500 | 26 | 59 days | 96.1% |
| Laguna Niguel | $1,390,000 | 62 | 22 days | 98.2% |
| Irvine | $1,444,000 | 176 | 38 days | 97.3% |
| Newport Beach | $3,742,105 | 76 | 42 days | 96.9% |
| Corona del Mar | $4,312,500 | 22 | 31 days | 98.1% |
| Newport Coast | $6,475,000 | 7 | 16 days | 95.2% |
| San Juan Capistrano | $1,825,000 | 32 | 14 days | 99.0% |
| Talega | $2,200,000 | 13 | 34 days | 98.2% |
| Orange County | $1,209,000 | 1,729 | 21 days | 98.8% |
November 2026 Market: Common Questions
Is the Orange County housing market slowing down in October 2026?
Yes, Orange County’s housing market is slowing, with demand at 1,219, the lowest October level since 2007. Active listings have increased to 4,948 from 4,288 last year, giving buyers more choices as demand weakens.
How long does it take to sell a home in Orange County right now?
Orange County’s expected market time is 122 days, compared with 83 days last year. Homes that closed in September had a median of 21 days on the market, which measures completed sales rather than expected market time.
Are home prices dropping in Orange County?
The available figures do not confirm that Orange County home prices are dropping. September’s median sale price was $1.209M, while 45% of active listings have had a price cut; asking-price reductions alone do not establish a decline in closed-sale prices.
What is the median home price in San Clemente, Dana Point and Laguna Beach?
For September 2026 closed sales across all home types, median sale prices were $2.2M in San Clemente, $2.43M in Dana Point and $3.09M in Laguna Beach. Median days on market were 13, 32 and 59, respectively.
How many homes are for sale in Orange County right now?
Orange County has 4,948 homes for sale in late October 2026. That is above last year’s 4,288 listings but below the 2017-19 average of 6,010.
Orange County figures reflect late October 2026; city figures are September 2026 closed sales, all home types.
What this means for buyers and sellers
For sellers, I would start with a candid look at comparable closed sales, active competition, and the condition of your home. A slower market does not mean you cannot sell, but it does make a well-supported asking price important. I would rather help you prepare a clear pricing plan than leave you reacting to a listing that is not connecting with buyers.
For buyers, more inventory is a reason to compare carefully, not assume every seller will accept a steep discount. Keep your financing and comfortable monthly payment at the center of the search. I would look at the relevant sales, the home’s time on market, and any price changes before deciding what an offer should look like.
If you are considering a move in Dana Point, San Clemente, Laguna Beach, or Laguna Niguel, I’m here to help you sort through what these numbers mean for your home or your search. For a personal price or market consultation with me, Patrick Parry, contact me.