Active Listing Inventory:
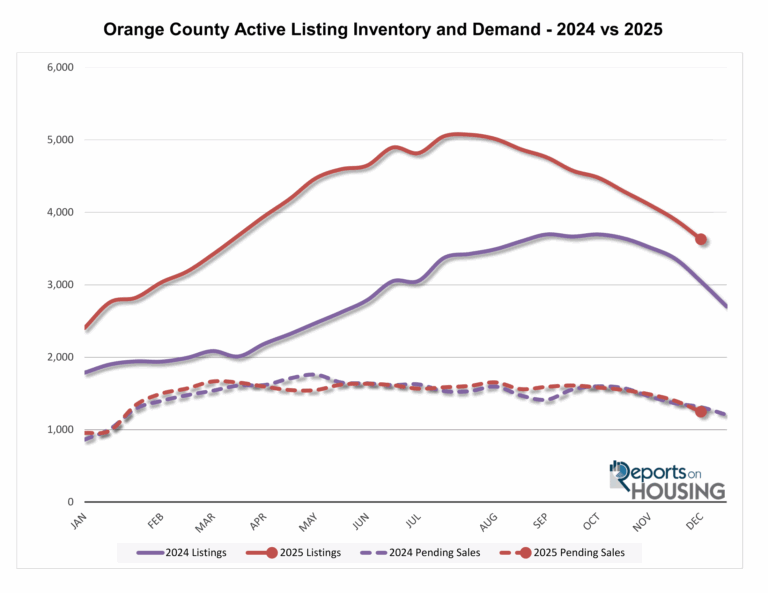
The active listing inventory in Orange County dropped by 268 homes over the past two weeks, a 7 percent decline, bringing the total to 3,629 homes, its largest drop of the year and lowest level since March. Since peaking in July at 5,071 homes, inventory has fallen 28 percent or 1,440 homes, a typical seasonal trend as sellers delist during the slow Holiday Market.
Compared to last year, inventory is 16 percent higher, with 585 more homes, but still well below the pre-COVID three-year average from 2017 to 2019 of 4,988 homes, which is 37 percent more than current levels.
Homeowners continue to hunker down due to low fixed-rate mortgages, keeping supply tight. Through November 2024, 25,630 homes entered the market, up from 22,118 in 2023 but still below pre-COVID averages, and November saw 1,504 new listings, slightly less than last year’s 1,522.
Demand and Market Pace:
Demand, measured by new pending sales over the prior month, dropped from 1,396 to 1,247 in the past couple of weeks, an 11 percent decline or 149 pending sales, marking the largest drop of the year and the lowest level since mid-January. This decline is surprising given that 30-year mortgage rates have remained between 6 and 6.5 percent, the lowest of the year, making affordability better than last year.
Compared to last year, demand is down 5 percent, with 63 fewer pending sales, and it remains 42 percent below the pre-COVID three-year average from 2017 to 2019, which was 1,774 pending sales or 527 more than today.
Economic releases and Federal Reserve actions will be critical for mortgage rates in the coming weeks, including the Fed meeting and news conference, November Jobs Report, retail sales, Consumer Price Index, and Personal Consumption Expenditures – all of which could influence whether rates rise or fall as we approach 2025.
Luxury End
Luxury home inventory in Orange County priced above $2.5 million decreased from 875 to 844 homes, a 4 percent drop, while demand fell 21 percent, with 36 fewer pending sales, causing the Expected Market Time to slow from 156 to 192 days, the slowest since early October.
By price range, market time for homes between $2.5 million and $4 million rose from 126 to 180 days, $4 million to $6 million remained at 143 days, and above $6 million increased from 273 to 287 days, meaning a luxury home could take until June 2026 to go pending at the current pace.
Seller Behavior:
Many sellers are holding off listing their homes, taking advantage of low fixed-rate mortgages and the slow Holiday Market, which has contributed to the significant drop in active inventory and a tighter supply overall.
Luxury home sellers are also experiencing longer market times, particularly for homes priced above $2.5 million, leading some to delay listings or adjust expectations as demand weakens and properties take months to go pending.

San Clemente Market Snapshot (December 2025)
- Median Days on Market: Around 25 days, showing a recent increase from the prior month’s low of about 15-20 days. Still a relatively quick turn around for sales.
- Closed Sales: Trending sharply down, from a recent high of about 65 units (around mid-2025) to approximately 35 closed sales in the last month, which is the lowest volume of 2025.
- Active Listings: Inventory has been generally decreasing since a peak of around 200 units earlier in the year. It is now hovering around 130 active listings on the market.
- Percent of List Price Received: The percentage has recently declined to approximately 97.0%, indicating a decrease in the price sellers are receiving relative to the original list price and suggesting buyers continue to find room for negotiation.
Takeaway: San Clemente’s market is showing signs of cooling as 2025 ends. The recent drop in Closed Sales and the increase in Median Days on Market indicate reduced buyer demand and velocity. While inventory is low, the Percent of List Price Received suggests that the market requires sellers to work with buyers and reduce their price to make a deal. A trend that has been constant in San Clemente for 2025. With the median time on the market in San Clemente still be relatively fast, sellers might price high but are taking offers under asking price. San Clemente sellers know while they can test a high price they still need to act fast and consider the early offers even when they are under asking.
Dana Point Market Snapshot (Decemeber 2025)
- Median Days on Market: Has increased recently and is currently around 30 days. This is an increase from the low points seen earlier in the year (around 20 days).
- Closed Sales: The volume has declined sharply in the last month of data, falling from a recent high of about 90-100 units to approximately 70 closed sales. This is a low point for the second half of 2025.
- Active Listings: Inventory has trended downward since a peak around 420-430 units mid year. It is now around 330-340 active listings on the market.
- Percent of List Price Received: The percentage has dropped falling to approximately 96.0%. This represents one of the lowest points recorded in the last 18-24 months of the chart.
Takeaway: The Dana Point market is experiencing a slowdown heading into the end of 2025. Holidays usually do this. Closed Sales have dropped and the Percent of List Price Received has fallen to a yearly low, indicating that sellers are making concessions. Although Active Listings in Dana Point have decreased from the annual peak, the combined data on sales volume and price received suggests a more balanced market.
| Metric | San Clemente | Dana Point |
|---|---|---|
| Median Days on Market | 25 days — up ~25% MoM | 30 days — up ~10% MoM |
| Closed Sales | 35 homes — down ~40% MoM | 70 homes — down ~15% MoM |
| Active Listings | 130 — down ~5% MoM | 330 — down 5% MoM |
| Median % of List Price Received | 97% — down ~0.5% MoM | 96% — down ~2% MoM |
up