Active Listing Inventory:
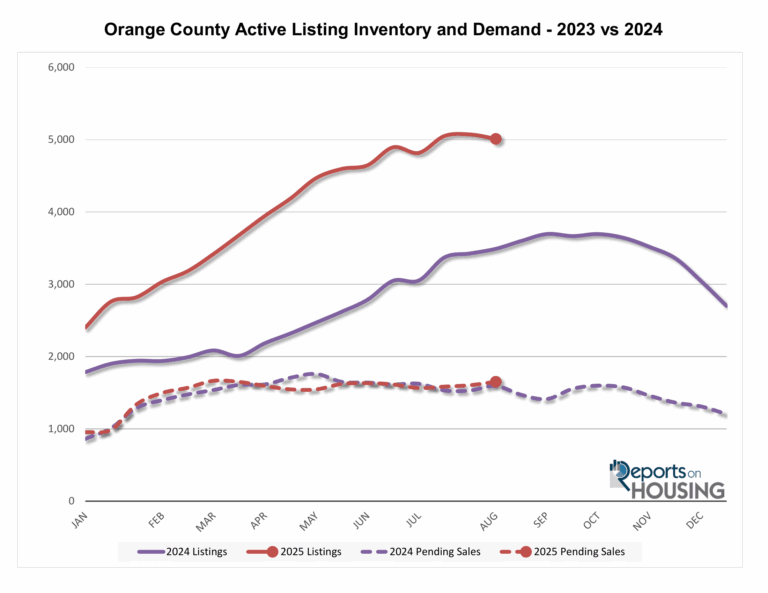
Active Inventory Trends: Orange County’s active listings dipped by 60 homes in the past two weeks to 5,011, suggesting the market hit its first normal July-to-August peak since 2022; improved interest rates have slowed inventory growth as demand strengthens, with future trends tied closely to mortgage rate movements.
Year-over-Year & Historical Context: Current inventory is 30% higher than last year’s 3,490 homes but still 34% below the pre-COVID (2017–2019) average of 6,723, as many homeowners remain “locked in” by low mortgage rates, though this trend is easing compared to 2023.
New Listings Supply: From January through July, 19,477 homes hit the market—25% fewer than the pre-COVID average; 2024 saw only 17,052 new listings and 2023 just 14,616, but more sellers are expected to participate in 2025.
Demand and Market Pace:
Demand Trends: Orange County demand rose from 1,604 to 1,652 pending sales over the past two weeks, a 3% increase and the largest since May, reaching its highest level since March’s peak of 1,665. Even slight improvements in mortgage rates have boosted buyer activity.
Mortgage Rates & Economic Outlook: Current mortgage rates, hovering between 6.5%–6.6%, are at their lowest since October 2023 and could dip below 6.5% if inflation eases and the labor market continues softening; the Federal Reserve is more likely to cut rates further if jobs data weakens.
Comparisons & Key Indicators Ahead: Demand is up slightly from last year’s 1,594 but remains 56% below the pre-COVID (2017–2019) average of 2,574. Upcoming economic reports—including the PMI this week and the PCE inflation gauge next week—will heavily influence the direction of mortgage rates.
Luxury End
Luxury Market Snapshot: Orange County’s $2.5M+ inventory slipped slightly from 1,201 to 1,191 homes (-1%), while demand dipped by two pending sales to 169. The overall Expected Market Time held steady at 211 days, its strongest since June, keeping the luxury market on solid footing as Wall Street strength supports confidence.
Segment Breakdown: Expected Market Time rose from 168 to 180 days for $2.5M–$4M homes, improved from 240 to 202 days for $4M–$6M homes, and ticked up from 318 to 321 days for $6M+ properties—placing the overall pace for luxury sellers at roughly March 2026 to enter escrow.
Seller Behavior:
More Realistic Pricing & Willingness to Negotiate: With 40% of homes already reducing prices, longer Expected Market Times (91 days overall, 211 days for luxury), and many listings lingering, more sellers—especially those with homes needing updates or in less desirable locations—are likely to adjust expectations, price more competitively, and entertain negotiations to attract buyers.
Selective Confidence in Turnkey & Luxury Segments: Sellers of well-priced, move-in-ready homes in desirable areas may remain confident, as these properties still draw multiple offers and sell quickly, while luxury sellers may stay patient given Wall Street-driven stability, but should still anticipate longer timelines and prepare for March 2026-type escrow pacing.

San Clemente Market Snapshot (August 2025)
Median Days on Market: 30 days — up ~20% MoM.
Closed Sales: 55 homes — down ~8% MoM.
Active Listings: ~195 homes — down ~1% MoM.
Median % of List Price Received: 95% — down ~3.5% MoM.
Takeaway: San Clemente is showing signs of cooling with homes sitting longer and sellers receiving slightly less than list, though inventory is tightening.
Dana Point Market Snapshot (August 2025)
Median Days on Market: 32 days — up ~15% MoM.
Closed Sales: 103 homes — up ~10% MoM.
Active Listings: ~350 homes — down ~12% MoM.
Median % of List Price Received: 98% — up ~1.5% MoM.
Takeaway: Dana Point sales remain strong with more closings despite fewer active listings, though buyers are taking a bit longer to commit.
| Metric | San Clemente | Dana Point |
|---|---|---|
| Median Days on Market | 25 days — up ~20% MoM | 30 days — up ~15% MoM |
| Closed Sales | 50 homes — down ~5% MoM | 60 homes — up ~10% MoM |
| Active Listings | ~210 — down ~8% MoM | ~160 — down ~12% MoM |
| Median % of List Price Received | 97% — down ~2% MoM | 98% — down ~1% MoM |
Takeaway: San Clemente is cooling slightly with longer market times and softer pricing, while Dana Point is seeing stronger sales activity despite shrinking inventory.